Category Archive: Uncategorized

  1. Financial Sponsors Trend Report – Company Q&A

    Comments Off on Financial Sponsors Trend Report – Company Q&A

    Solomon Partners Financial Sponsors and Campbell Lutyens Full Interview Transcript

    Solomon: Can you share an overview of Campbell Lutyens services including its secondary advisory capabilities?

    Campbell Lutyens (“CL”): Established in 1988, Campbell Lutyens is the largest independent private markets advisory firm of its type globally with more than 290 employees across its offices in New York, London, Paris, Munich, Chicago, Los Angeles, Dubai, Charlotte, Hong Kong, Melbourne, Singapore, Tokyo, and Seoul. CL is 100% employee-owned by current employees, with no external shareholders.

    CL is recognized as a market leader in private equity, real assets, and private credit globally across three business lines:

    • Global fund placement: 30+-year track record with high completion rates; team has raised more than $315bn for 295+ private equity, real asset, and private credit funds
    • Secondary advisory: 25+-year track record having completed $135bn+ of transaction volume across 330+ mandates to date
    • GP capital advisory: Consult leading fund managers on a wide range of financings and transactions including minority and/or majority equity investments, M&A, alternative financing structures, secondary sales of GP minority investments, succession planning and valuation advice

    Within secondary advisory, CL advises across a range of secondary solutions, including LP portfolios sales as well as continuation funds and other GP-led liquidity transactions. In 2024, the firm advised on $23bn of total secondary volume, including $11bn of GP-led transactions. CL has advised on continuation vehicles — ranging in size from $100m to $3bn+ — and is very active particularly across the middle market advising on such transactions.

    What trends are you seeing across recent CV activity?

    CV transaction volume is at a record high and continues to gain momentum. Total GP-led volume in H1 2025 was $48bn, up 72% year-over-year. This growth followed a record year of annual CV volume in 2024 of $65bn, up 47% from 2023 and eclipsing the previous high-water mark set in 2021 of $60bn. Sales to CVs accounted for a record 13% of total private equity exits globally in 2024, up from 5% in 2021, as CVs continue to take share from sponsor-to-sponsor transactions.

    Several factors driving the sustained growth of the CV market include:

    • Challenging traditional exit markets (M&A, IPOs) have led more sponsors to seek alternatives for their assets
    • Many LPs remain overweight to PE and are looking to their GPs to generate liquidity
    • New capital sources, including direct sponsors and family offices, have entered the secondary buy-side to invest in CV opportunities
    • Ability for sponsors to utilize CVs as a strategic fundraising tool amid a challenging primary fundraising environment

    Can you share the benefits of CVs for all stakeholders in a transaction?

    The key stakeholders in a CV transaction include the GP, company management, existing LPs and new investors, with select benefits for each:

    • GP:
      • Secure longer runway to retain and grow winning asset(s)
      • Raise follow-on capital to support strategic growth plans
      • Create DPI for existing vehicle(s)
      • Crystallize carried interest generated to date
      • Achieve new remuneration structure and realign incentives
      • Broaden LP relationships
    • Management team (in addition to select items noted above):
      • Ability to continue partnering with current sponsor owner
      • Fully crystallize and cash out portion of MIP/equity stake
    • Existing LPs:
      • Option to generate liquidity and de-risk returns; or
      • Maintain exposure and participate in the upside generated by the continuation fund
    • New investors:
      • Opportunity to complete deeper due diligence than in a traditional secondary transaction
      • Ability to structure GP alignment, fund terms and governance to fit profile of the investment

    What factors lead to a successful CV outcome?

    Features of an attractive continuation vehicle asset typically include:

    • Sufficient scale – for buyout-focused opportunities, companies with at least $20m of EBITDA, with the sweet spot being $30-50m+ for most mid-market focused investors
    • Sector-resilient industries such as software, business services, healthcare, infrastructure, and industrials are in favor
    • Market positioning – preference to invest in market-leading businesses with pricing power and ability to pass through cost inflation
    • Strong historical performance – for single-asset CVs, companies that have delivered 2-3x+ MOIC to the existing fund(s)
    • Conservative leverage – ideally no higher than 4-5x EBITDA
    • Ownership/cap table – preference to invest in assets where the sponsor holds majority interest
    • Accretive follow-on opportunities – ability to deploy capital to drive growth, in particular for buy and build strategies
    • Strong upside potential – secondary investors will typically target a net MOIC of at least 2x+ over the next 3-5 years

    Can you describe the components of a CV process – how is it similar/different to a sell-side process?

    A CV process typically takes 4-5 months and combines elements of both an M&A sell-side and a traditional fundraise.    

    The initial part of the transaction is geared toward finding a lead or anchor investor that will set price/terms, negotiate definitive documentation and write a meaningful ticket into the CV. This is typically conducted through a two-stage auction process over a 7-8-week period. Diligence materials including a CIM and model alongside other company/market related materials (e.g., Q of E) are shared with potential anchor investors at the outset, with the GP also making themselves available for diligence calls during the initial phase. Following the receipt of initial indications (4 weeks), shortlisted investors are provided with an additional period (3-4 weeks) to conduct more detailed diligence, including holding potential management meetings/site visits. On the receipt of binding offers, a lead or group of lead investors is selected to negotiate key transaction documentation, including a PSA between the CV and the existing fund(s) and an LPA for the new vehicle. 

    Following the lead investor phase, a syndication process is conducted over the next several weeks to raise the equity commitments needed to cover the remainder of the transaction. Syndicate investors will review the materials prepared to date and heavily rely on the diligence conducted by the lead investor(s), with some groups still potentially wanting to spend direct time with the GP.

    Once the transaction is fully subscribed, the existing fund’s LPAC is consulted to waive any related conflicts for the transaction, followed by an LP election process (typically 20 business days), where existing investors are asked to make a decision to either sell or roll their exposure into the CV. 

    How has the mix between single-asset and multi-asset CVs shifted, and what are the key drivers behind it?

    In 2024, single-asset transactions represented nearly 60% of the CV market, driven by a larger supply of GPs looking to retain top assets and increasing appetite from investors to make concentrated bets in a rising market environment. So far in 2025, we have seen a more even split of volumes between single and multi-asset CVs (53% and 47%, respectively), as certain traditional secondary investors favor acquiring more diversified exposures and GPs show an increased willingness to include more assets and maximize DPI impact in a low-distribution environment.

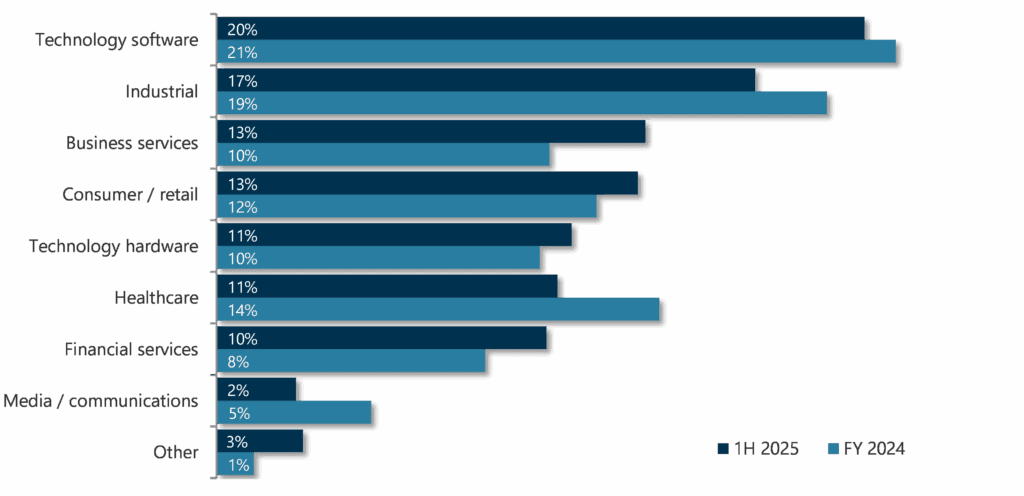
    Are there specific sectors or asset types driving most of the GP-led activity?

    Please see below a breakdown of assets sold in GP-led transactions by sector. In general, investors continue to favor insulated industries, including technology, business services, industrials, and healthcare.

    Source: Campbell Lutyens

    Have there been any innovative structures in recent CV offerings?

    We are seeing sponsors creatively incorporating continuation funds into broader strategic initiatives at portfolio companies. As an example, CL is currently advising on a process involving two mid-market sponsors that are contemplating a CV in tandem with a proposed merger of two underlying assets.  Also, we are starting to see some sponsors who face primary fundraising challenges turning to broader fund restructuring secondary transactions as a means to raise capital for new platform investments.

    What are your views on activity over the next 12-18 months, with the potential for Fed rate reductions and increased PE exits/IPO window re-opening?

    We expect CV volumes to continue to grow over the near-to-medium term. While there are some early signs that the M&A and IPO markets may finally be easing/opening, there continues to be a growing NAV pool of assets within private markets which sponsors will need to deliver liquidity on. We expect continued adoption by GPs of CV technology and expect most sponsors going forward to pursue at least 1-2 CVs per fund. Most sponsors we speak with look at CVs as a strategic tool to continue to grow and compound their best assets and are pursuing these transactions for the right reasons vs. viewing CVs as just another exit option. Buy-side capital for these opportunities will further scale as direct sponsors continue to enter the space and established players raise larger flagship funds and/or dedicated GP-led vehicles.


    Campbell Lutyens participants in this interview included:

    Gerald Cooper
    Partner & Global Co-Head of Secondaries

    Chirag H. Shah
    Managing Director

    Stephen Henderson
    Managing Director

    Brian Susetka
    Managing Director

  2. 2024 FSG Year-End Report – Interview Transcript

    Comments Off on 2024 FSG Year-End Report – Interview Transcript

    Industry Insights

  3. Protected: M&A Outlook

    Comments Off on Protected: M&A Outlook

    This content is password protected. To view it please enter your password below:

  4. In-Store Retail Media Networks: Expect the Unexpected

    Comments Off on In-Store Retail Media Networks: Expect the Unexpected

    In-Store Retail Media Networks: Expect the Unexpected

    2025 Market and M&A Analysis

    Read Head of Media Mark Boidman‘s presentation at NRF 2025 on key trends, potential opportunities and more within the dynamic retail media landscape from this year’s What’s in Store for Retail Media Networks event.

  5. 2024 FSG Mid-Year Report – Interview Transcript

    Comments Off on 2024 FSG Mid-Year Report – Interview Transcript

    Riveron Interview with Michael Funkey, Managing Director, and Tony Doesburg, Managing Director

    • Solomon Partners: Can you provide introductions and a brief overview of Riveron?
      • Riveron: Founded in 2006, we help professionals simplify and solve complex business problems. Riveron partners with CFOs, private equity firms, and other stakeholders to maximize outcomes. Our teams bring industry perspective and a full suite of solutions focused on the office of the CFO, M&A, and distress. In 2023, the company was acquired by affiliates of Kohlberg & Company from H.I.G. Capital – which is continuing its partnership with Riveron through a minority investment and we now have 16 global offices.
    • How have you seen the market within 1H 2024 within Transaction Services vs. prior years?
      • The M&A market in 1H 2024 has benefited from 1) stabilization of cost of debt: by January 2024, most had gained confidence the cost of debt had peaked, and while higher than historical averages, has been stable throughout the year, providing a critical, much-welcomed level of certainty absent since early 2022; and (2) functional credit markets: private credit, albeit at a higher cost, has been as accessible as it’s been in several years in 1H 2024, as concerns / uncertainty related to macroeconomic, recessionary concerns have largely subsided.
    • Are there other divisions that have been as active within Riveron?
      • Our clients, both corporate and private equity, are under pressure to continue to grow profitability despite the challenges faced in the current higher cost of capital environment.  Our Performance Improvement and Technology Enablement offerings have seen historically high demand as the need to enable more efficient and streamlined operations to meet the uncompromising expectations of stakeholders remains ever present regardless of macro-economic conditions.
    • Can you provide insight into the number of mandates that have translated into closed transactions? How does this compare to 2023 and 2019?
      • With that rapidly rising cost of debt throughout 2022 and early 2023 and the macroeconomic uncertainty through much of 2023, we certainly saw challenges in successfully closing transactions vs historical norms, scene in prior years including 2019. As private equity buyers, in particular, face a different equation in this higher cost of capital environment, elevated scrutiny and level of expectations toward the quality of a potential investment’s infrastructure, systems, financial/accounting functionality and much more.
    • Have you experienced a narrowing of the bid / ask spread?
      • We’ve seen some incremental progress throughout 1H 2024.  While high, the cost of debt has stabilized.  As potential investors adjust their valuation models and investment strategies, we’ve seen progress and expect momentum to accelerate as investors adapt and competition for quality assets continues to increase.
      • Leveraged financing is no longer enough on its own to meet shareholder expectations; and as such we’ve seen a material increase in the level of expectations of Buyers as it relates to sell-side readiness.  Demand for Riveron’s broader sell-side readiness solutions has increased incrementally.  Financial advisors have seen the critical need for businesses to make investments in things like streamlined FP&A reporting, integration, ERP system optimization, and other similar FP&A and operational upgrades – areas that go beyond the traditional financial and tax diligence preparation that sufficed on so many occasions in the extreme low-cost debt environment of the years leading up to 2022.
    • For deals that get completed, has there been any impact on time to close and, if so, why?
      • The level of scrutiny of potential buyers has increased substantially. We strongly advise business owners to prepare accordingly. On average, the time from the start of a go-to-market effort to successful close has increased by an average of 45 days in 1H 2024 vs. historical averages. For the time being, in this high cost of capital environment, buyers are taking great care to invest time and resources needed into a far more comprehensive, broad diligence process pre-close to ensure all areas in need of investment post-close are fully contemplated in valuation models.
    • Have any new industry trends have helped propel a transaction to close? Would you have recommendations to funds looking to bring an asset to market in this environment? [related to your dashboard/analytics integration comment]
      • The sooner you act the better, even if starting with assessments in certain areas to develop a plan as things continue to evolve in the market.  There are always options if you start early enough – understanding what can be improved and what’s critical to succeed when the time is ‘now’ to go to market and maximize value.  Waiting until it’s time to sell to prepare is the most common, and arguably unnecessarily dilutive, mistake we encounter on a day-to-day basis.  There’s no reason not to plan and there’s never any better time to start thinking about an exit strategy that maximizes shareholder returns than now.
    • Is there any relationship between size (EBITDA) and deal activity or success of outcome?
      • In terms of the number of closed deals, in 1H 2024 the largest deals: $500M to $1B (up over 18% YoY as of YTD May24) and $1B+ (up 26.2% YoY as of YTD May24) have recovered more quickly. Meanwhile, all smaller categories were still down YoY with total closed deals down a little over 17% as of YTD May24. It’s likely that the success we’ve seen at the top end of the middle market will continue to add to the growing M&A momentum we’re experiencing as we move forward into H2 2024. The largest assets were prioritized, but the broader market is quickly showing increased activity and following the lead.
    • What sector has generated the most and least assignments?
      • Interestingly, we’ve seen the macro trends discussed throughout playing a predominant role in most industries.  There are some sectors, such as building products and industrials more broadly, and others, that started to re-accelerate more quickly than others in 2024; however, the historically large backlog of assets to be sold in the next year spreads across nearly every corner of the market.
    • With the current state of the market, has your team experienced an uptick in corporate carveout mandates?
      • We have certainly started to see an increase in recent months as many corporates have implemented many of the efficiency improvements prioritized in 2023 have been implemented and the everlasting high demands of shareholders for continued earnings growth persist.  Adding to this, the full impact of fiscal policy tightening has only just begun to be felt in some important ways; a record number of corporates have been required or plan to restructure debt in 2024 at a much higher rate than what’s been seen in many years. Corporates are demonstrating a high level of awareness to consider whether less strategic and/or underperforming business units should be divested in order to reduce liquidity needs before committing to new financing requirements.
    • What is the firm’s outlook for activity through the remainder of 2024 and 2025
      • We will remain nimble, as always, and anticipate a need for continued agility and continuous assessment of conditions in H2 2024.  While we see solid momentum going into the back half of the year in the M&A environment, we’re all still waiting in anticipation to see the first rate cuts by the Fed.  We also have a presidential election to get through, of course.
      • What we do know is that the reasons to be bullish about the near future, including 2H 2024 and 2025, are very real and historic.  Private equity holds 28,000 portfolio companies globally and as of the start of 2024, approximately half had reached a holding period of four years or longer.  This is an incredible number of assets reaching, or at, the end of their holding periods. Add to this the fact that dry powder remains near the all-time highs of more than 1.5 trillion dollars after the historic fundraising of 2021, and you’ve plenty of reason to anticipate a great deal of M&A activity coming in the very near future.
  6. State of the Global OOH Media Market – June 2024

    Comments Off on State of the Global OOH Media Market – June 2024

    State of the Global OOH Media Market – June 2024

    Learn the latest trends and current events influencing the global out of home media market, along with an overview of the industry’s performance from Head of Global Media Mark Boidman.

  7. Scott Moses Shares “5 Things You Might Not Know – Dollar General” – March 2024

    Comments Off on Scott Moses Shares “5 Things You Might Not Know – Dollar General” – March 2024

    Scott Moses, Head of Grocery, Pharmacy & Restaurants, provides updated insight on Dollar General, America’s #1 grocer by store count, with over 20,000 grocery stores.

    Dollar General has grown its grocery sales by 8x in the past 20 years and has the highest gross margin in American grocery (after Amazon), with over 170,000 non-union employees.

  8. Scott Moses Shares “5 Things You Might Not Know – Aldi” – March 2024

    Comments Off on Scott Moses Shares “5 Things You Might Not Know – Aldi” – March 2024

    Scott Moses, Head of Grocery, Pharmacy & Restaurants, provides updated insight on Aldi, the #3 grocer globally and #2 grocer in Europe.

    Aldi is owned by the same family that owns Trader Joe’s; with over 12,000 grocery stores globally and ~2,800 grocery stores in the U.S., “Aldi is one of America’s fastest-growing retailers.”